GrowNYC
GrowNYC provided data on 2017 Greenmarket locations market locations, producer locations and growing practices, and EBT spending.
In New York State
were spent at 228 authorized farmers markets
Roughly one third of these entitlement dollars were spent at NYC Greenmarkets. The expansion of SNAP/EBT at Greenmarkets helps to increase food access for low income New Yorkers and increase incomes for regional farmers--goals central to the objective of contemporary food system reform and imperative to both ending food insecurity and mitigating climate implications for agriculture.
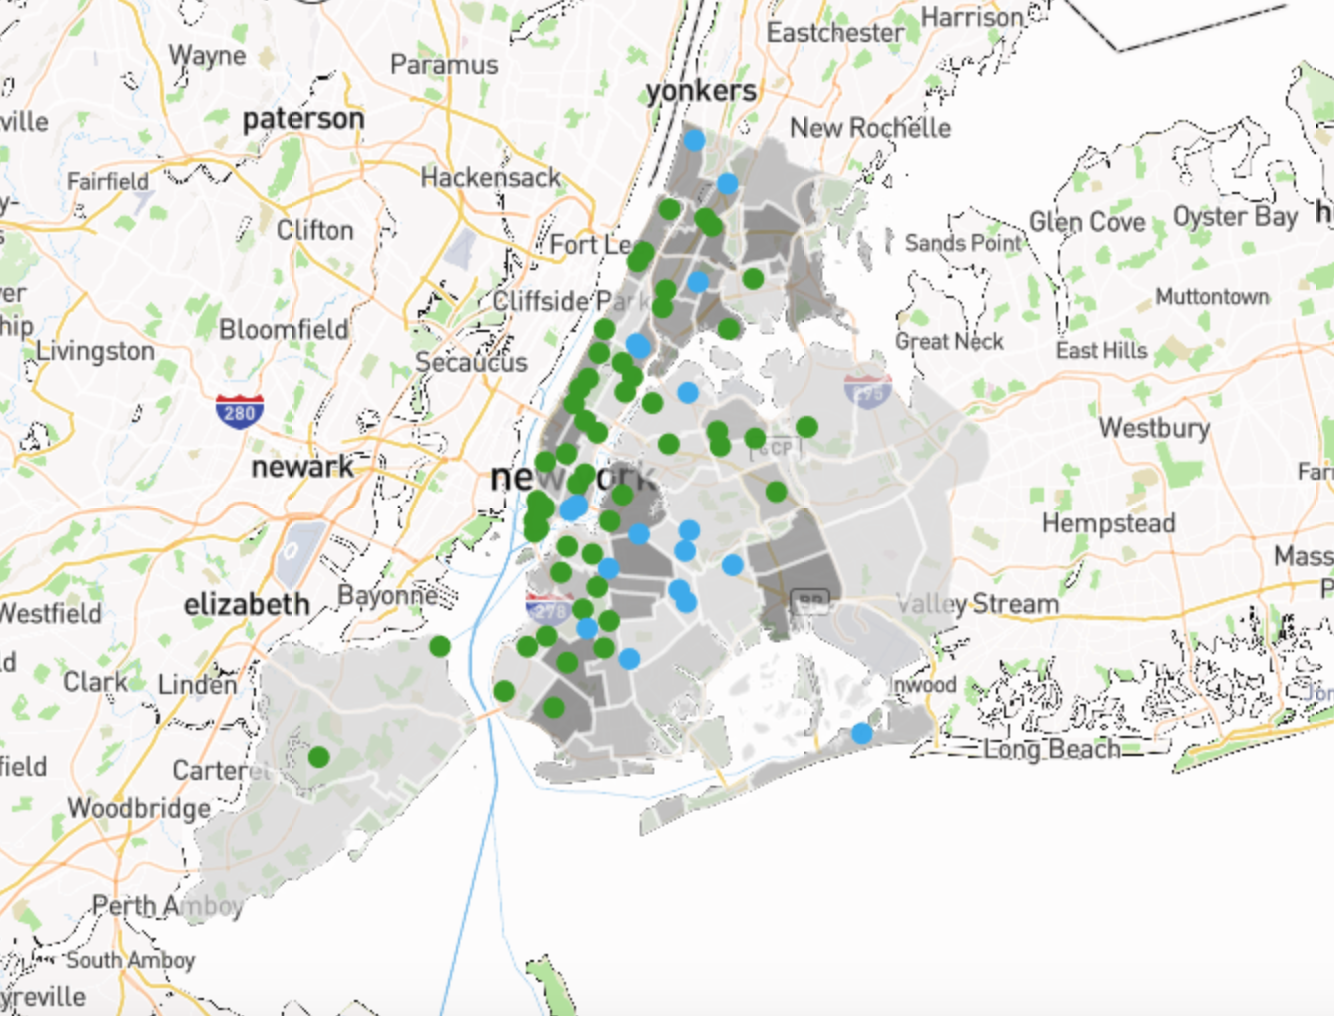
This project visualizes each of those goals to better understand which producers and growing practices are bolstered by increased spending, and inversely, the degree to which EBT customers have acess to sustainably produced food. The market map shows market access for EBT cusomers in NYC. The producer map shows how those EBT dollars contribute to rural economies in the Northeastern U.S. and how Greenmarket producers are impacting soil quality through their growing practices (crop diversity and percent cultivated land). A spatial understanding of these relationships is of interest to farmers market opertors whose understanding of EBT spending patterns helps them to support their vendors in pursuit of more sustinable land management. It is also of interest to stakeholders in the food justice movement who want to advocate for food system reform through the lens of sustinable production and equitable consumption.
This project was developed in coordination with GrowNYC/Greenmarket for graduate research at the Milano School of International Affairs at The New School.

Clicking directly on a producer location shows the name of the business, the number of acres, and the products grown and sold at Greenmarket. Zooming into a state shows EBT spending on producers summarized to their home congressional districts. It also displays stats related to EBT spending and growing practices in the state. The "Growing practices" sliders filter producers based on their growing practices. High diversity and low percentages of cultivated lad are indicators of sustainable farming to the extent that they help improve soil quality through carbon sequestration.

Clicking directly on a market location shows the name and season of operation (months and days of the week). Market locations are overlaid on demographic data and sea level rise data, two layers which can be clicked on and off. Demographic data shows the percent of each community district receiving public assistance using a color gradient. Sea level rise shows the projected shoreline by 2020. This data can be helpful to understand the vulnerabilities of certain markets for food security and climate mitigation planning efforts.
GrowNYC provided data on 2017 Greenmarket locations market locations, producer locations and growing practices, and EBT spending.
Community District shapefile; Community District Breakdowns; Sea Level Rise Maps (2020s 100-year Floodplain)
Congressional Districts shapefile
Wolkomir, E. (2018). “SNAP Boosts Retailers and Local Economies.” https://www.cbpp.org/research/food-assistance/snap-boosts-retailers-and-local-economies;
USDA Report. “Comparison of SNAP Authorized Farmers and Markets FY2012 and FY2017.” https://fns-prod.azureedge.net/sites/default/files/snap/SNAP-Farmers-Markets- Redemptions.pdf